TIG Stack - Monitoring Systems
The “TIG Stack” consists of Telegraf, InfluxDB and Grafana and is a powerful combination of application to collect, display and monitor time series data.
Telegraf
Telegraf is an open source application written in Go that collects, processes, aggregates and writes metrics. It’s lightweight and thanks to Go easy to compile for many different platforms and architectures. The plugin based architecture allows for great extensibility.
InfluxDB
InfluxDB is an open source time series database platform written in Go. It comes with it’s own flux query language which includes many powerful features for time series data manipulation and even goes beyond just queries. It’s more of a scripting language where you can process data, import libraries and send queries to other databases.
There’s a web based admin dashboard that allows you to manage you database, create dashboards, schedule tasks and create scrapers. You can also view a list client libraries for various languages with code examples.
Grafana
Grafana is an open source web based application written in Go and TypeScript that allows to create dashboards with rich visualizations and constantly monitor all measurements. Grafana is able to visualize data from a wide variety of databases or other data sources. Using the plugin system pretty much every aspect of Grafana can be customized and extended as needed.
Server Setup
First of all let’s set up the server (InfluxDB, Grafana). Both of these applications will be running inside a docker container so make sure to install docker before continuing.
Docker desktop is not needed, I’d recommend using Portainer CE (Web), lazydocker (CLI) or VSCode with the docker extension.
Now pull the images for influxdb and grafana:
docker pull influxdb
docker pull grafana/grafana
While it’s possible to just run both applications from a single docker-compose.yml file i prefer to keep them in seperate directories. With that said create the following directory structure:
📂docker-apps
 ┣ 📂grafana
 ┃ ┣ 📜docker-compose.yml
 ┣ 📂influxdb
 ┃ ┣ 📜docker-compose.yml
Let’s start with the compose file for grafana:
version: "3"

services:
  grafana:
    image: grafana/grafana-oss:latest
    container_name: grafana
    restart: always
    ports:
      - "127.0.0.1:3030:3000"
    volumes:
      - "./grafana_data:/var/lib/grafana:rw"
    networks:
      - grafana_net

networks:
  grafana_net:
    name: "grafana_net"
Then run following command to start grafana:
docker compose up -dBesides starting grafana and exposing the internal port 3000 to the local port 3030 this also creates the network “grafana_net” which will be used by all other docker compose services which need to be connected to grafana.
The volume configuration uses “bind mounts” to mount a local directory into the container. This is not ideal for security, but makes it easier to inspect the files and back up the data. You can remove that part and back up the corresponding docker volume instead.
version: "3"

services:
  influxdb:
    image: influxdb:latest
    container_name: influxdb
    restart: always
    volumes:
      - "./influx_data_lib:/var/lib/influxdb2"
      - "./influx_data_etc:/etc/influxdb2"
    ports:
      - "127.0.0.1:8086:8086"
    networks:
      - grafana_net

networks:
  grafana_net:
    external: true
Pretty much the same as grafana, except that the network “grafana_net” is defined as external. Start influxdb using docker compose up -d.
Client Setup
Every client to be monitored needs to be able to reach the InfluxDB container! To keep it simple we’ll start by monitoring the server itself.
Start by installing telegraf then head over to the InfluxDB web interface at http://localhost:8086.
- Load Data -> Buckets -> Create Bucket
- Load Data -> Telegraf -> Create Configuration
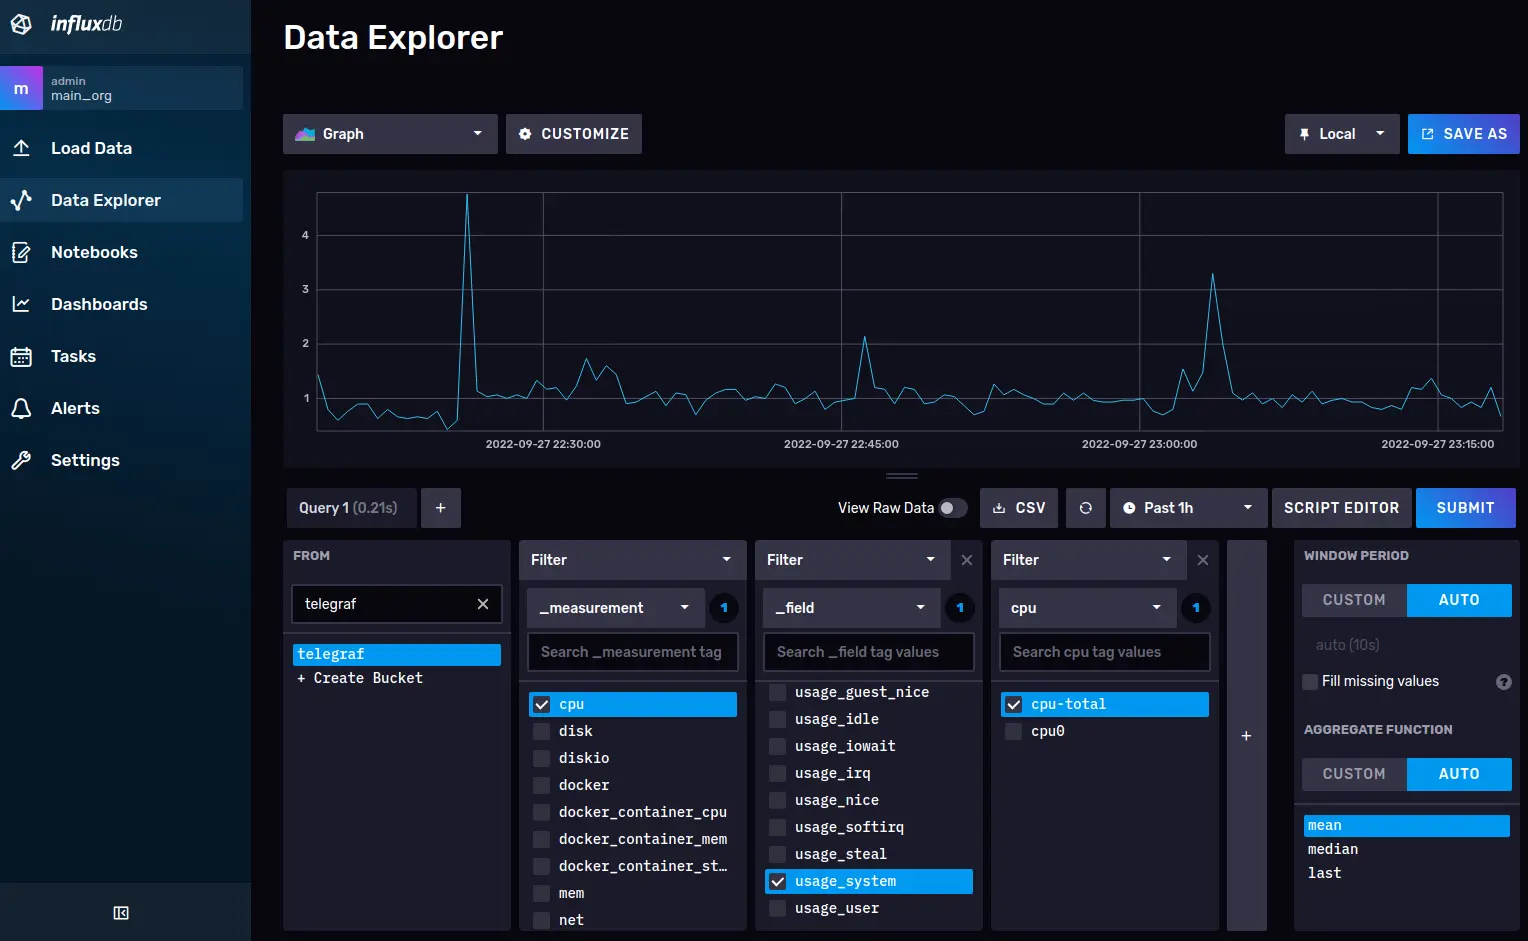
Follow the instructions on screen and verify that telegraf is able to write data. The easiest way to quickly visualize captured data is to use the “Data Explorer” in the web interface of InfluxDB.
To make the configuration permanent edit /lib/systemd/system/telegraf.service and add or modify following 2 lines using the values from the “telegraf - create configuration” step.
Environment="INFLUX_TOKEN=yourinfluxtoken"
ExecStart=/usr/bin/telegraf --config http://localhost:8086/api/v2/telegrafs/12341234
Reload service configurations
sudo systemctl daemon-reloadRestart the service
sudo service telegraf restartOnce again, verify that telegraf is still able to write data.
Grafana Setup
Now head over to grafana at http://localhost:3030. The default username and password is admin.
Grafana can be daunting at first but has a good documentation and active community. To visualize your data from InfluxDB and add alerts start with these links: